Real-time signage that works in the field, not just on the spec sheet.
I help transit agencies and their suppliers plan, deploy and keep running solar and e-paper passenger information displays, from site assessment through installation to fleet monitoring, and bring struggling deployments back to reliable operation.
Metro areas where I have deployed, commissioned, supported or designed passenger information systems, coast to coast, plus projects in Canada.
11 yearsin transit technology deployment
—largest U.S. bus systems served, carrying — annual bus riders
—largest U.S. bus systems served
—metro areas with deployments, coast to coast
Rankings: American Public Transportation Association (APTA), 2026 Public Transportation Fact Book, Table 4: the 50 largest U.S. bus agencies by unlinked passenger trips, 2024 data.
Metro areas with deployments
Top-50 U.S. bus system Other agency deployments On-site field work in metro areas · metro areas across states
Platform-independent experience
Few engineers have deployed e-paper signage from several competing manufacturers. I have designed, installed, configured and supported systems across the leading e-paper, LCD and LED, solar power and content platforms, so I can tell agencies and suppliers how they actually behave in the field and which choices hold up.
Unbiased evaluation — compare platforms on real-world power, connectivity and maintenance, not brochures
Integration across vendors — displays, solar power systems, controllers and content management that were never designed together
Faster root-cause diagnosis — patterns recognized across products and deployments, so an issue already solved in one rollout is identified and resolved quickly in the next
Solar signage that works in summer can go dark in winter. Short days, low sun angles, seasonal shade from buildings and trees, and cold batteries all cut the power available, and they tend to arrive at once. Year-round uptime has to be designed in from the start and verified in operation.
Panel in sun all day
June 21Surplus · 252% of load
Noon sun
70.4°
Daylight
15h 22m
Solar yield
136Wh/day
Panel shaded 8:07–11:02
September 22Surplus · 137% of load
Noon sun
47.0°
Daylight
12h 09m
Solar yield
74Wh/day
Panel shaded 8:03–11:13
December 21Deficit · 62% of load
Noon sun
23.6°
Daylight
9h 00m
Solar yield
34Wh/day
Overnight low −10 °C
February 15Deficit · 45% of load
Noon sun
33.9°
Daylight
10h 29m
Usable battery
76%
Clear-sky model for a stop at 43° N, shown at solar noon: 20 W panel, 54 Wh/day load. On 21 December the building shades the panel from 8:03 to 11:13. February adds an illustrative cold-weather battery model: no charging below 0 °C, self-heating and a snow-dusted panel.
Worst-case sizing — panels, batteries and power budgets sized for the shortest, darkest weeks at each specific stop
Shade measured, not guessed — LiDAR, imagery and sun-path modeling show winter shading before a site is approved
Smart power management — display refresh, lighting and check-in schedules tuned to what the site can sustain
Continuous verification — voltage and uptime monitoring that flags a weakening site weeks before riders notice
Cold-weather capacity — battery chemistry, charge limits and enclosures planned for January and February, when the sun returns but cold batteries hold and accept less charge
Product development
Hardware and specifications I developed for solar e-paper deployments.
Anti-vandalism polycarbonate display cover — conceived the design and 3D-printed the prototypes; the cover passed impact (IK) testing and is in use in Connecticut, rolling out with Big Blue Bus, ordered for LA Metro, in testing at OCTA and going onto WMATA's pilot sign
SELS Smart TPS solar lighting and power system — authored the solar power enclosure specification and the wiring, connector and QA standards used for solar e-paper and stop lighting
Connectpoint second-generation CP-10 display and solar box — closely involved in developing Connectpoint’s second-generation 10-inch solar e-paper display and its solar power box
Case studies
Twelve programs, in brief. Five are shown here, with seven more below.
Sample screens from the layout, rotating between a normal day, a flood day and a heat advisory, shown as mockups on a 32-inch solar e-paper sign
Chatham County, NC: live river access safety signs
Chatham County Parks and Recreation wanted signs at Haw River access points that tell paddlers and visitors, in English and Spanish, whether access is open, what the river is doing and whether conditions are safe, at remote sites with no power or data cabling.
What I did
Co-designed the display layout with Chatham County Parks and Recreation, working hand in hand with the county's project lead in regular meetings, and built it myself: bilingual access status and alerts, current weather, river stage and flow against flood stage from the USGS gauge, and air quality, arranged for legibility on a 32-inch grayscale e-paper screen. Worked with the software team on content sources, and set the signs up in the content management system and on cellular.
Outcome
Solar-powered signs giving visitors live, plain-language safety information at the water's edge, updated automatically from public data sources.
Technology and methodsPapercastSolar e-paperInformation designUSGS river dataAir quality dataCellular
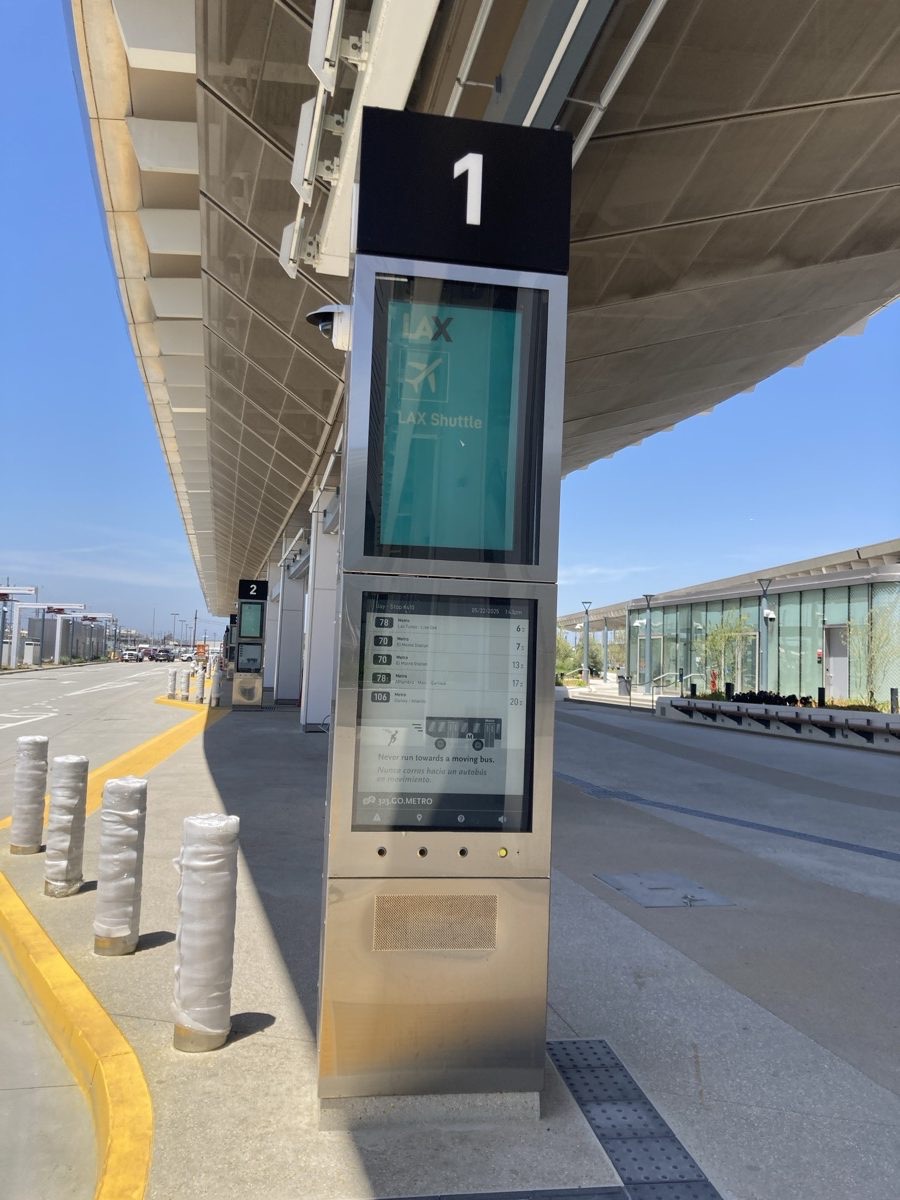
LA Metro: LAX/Metro Transit Center
Los Angeles, CA · 2025 · Station passenger information displays · Part of the ~$900M LAX/Metro Transit Center
Challenge
The new LAX/Metro Transit Center, the hub linking Metro rail and bus services with the airport, needed passenger information at its bus bays ready for opening. Each bay has its own display pylon with real-time arrivals and audio announcements.
What I did
Worked on site in the weeks around the launch on configuration, commissioning and checks of the bay display pylons, including the e-paper arrival screens and audio buttons.
Outcome
Bay displays in service for the opening of the transit hub in 2025, showing real-time departures for the routes serving each bay.
Technology and methodsPapercastE-paper arrivalsLCD screensAudio announcementsCommissioning
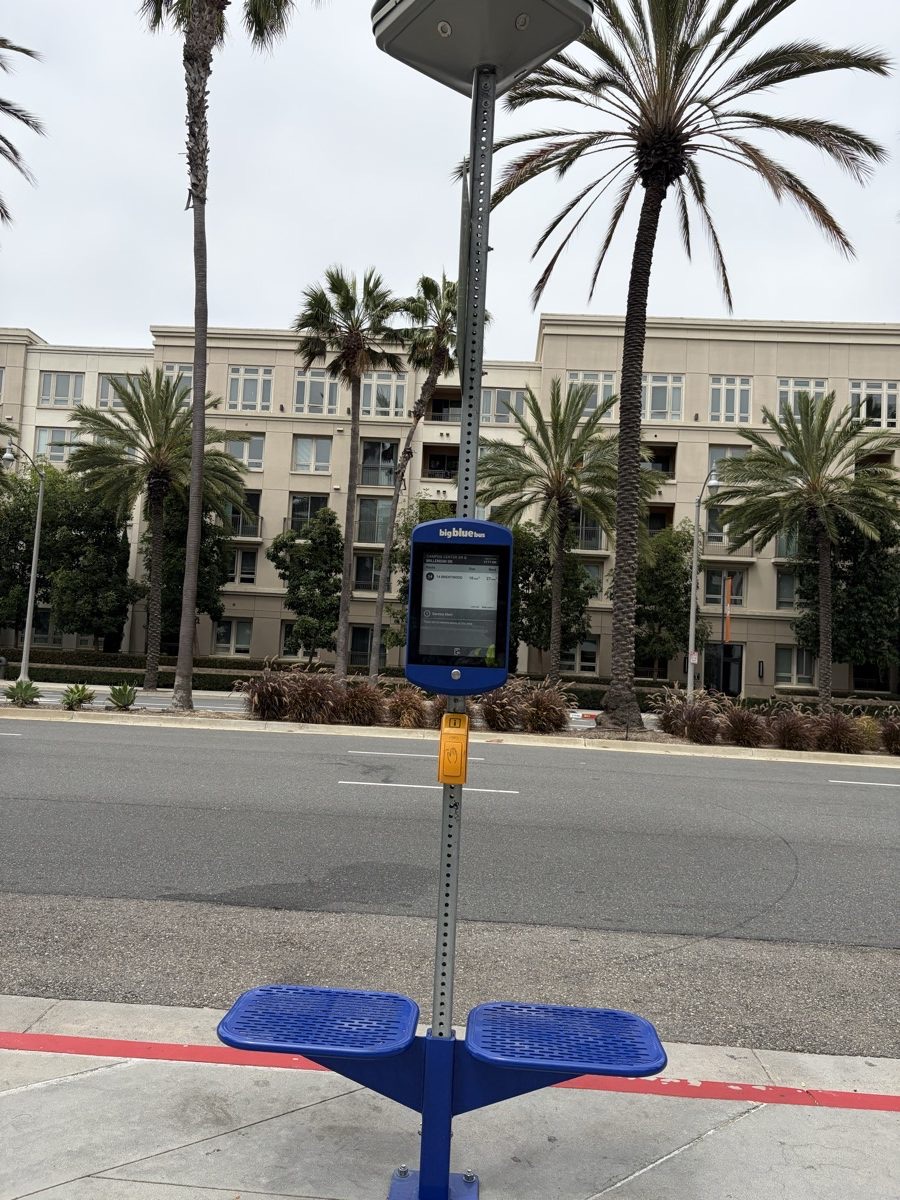
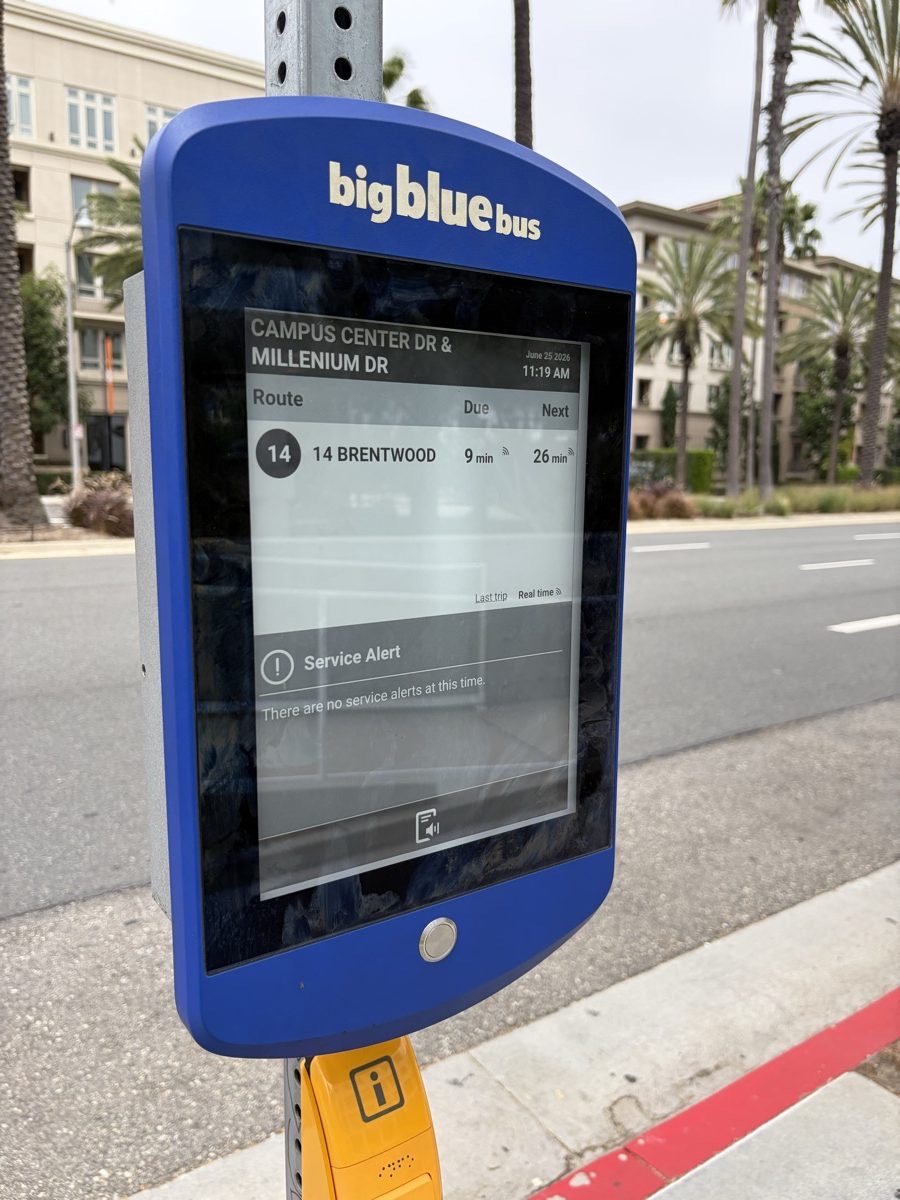
Big Blue Bus: stop-by-stop assessment, solar e-paper and solar stop lighting
Santa Monica, CA · Assessment and delivery, in progress 2026 · 125 solar e-paper displays with solar stop lighting
Challenge
Big Blue Bus planned solar-powered real-time displays with integrated solar lighting at stops across its network, so riders get arrival information and a lit stop without new electrical service. Street trees, buildings and pole positions differ at every stop, so each site needed its own answer on solar access and placement.
What I did
Assessed about 135 candidate sites, combining remote analysis of imagery and shade with field visits, and produced a per-site assessment card with solar, shade and placement recommendations. Tested the solar power modules at my own facility and wrote the charge controller configuration used in the field. I am now supporting delivery of the 125-display program.
Outcome
A documented recommendation for every assessed stop, ready for agency review. Displays are going into service at stops across the network, with delivery continuing through 2026.
Technology and methodsPapercastSolar e-paperSolar lightingLiDAR and imageryShade modelingSite assessment
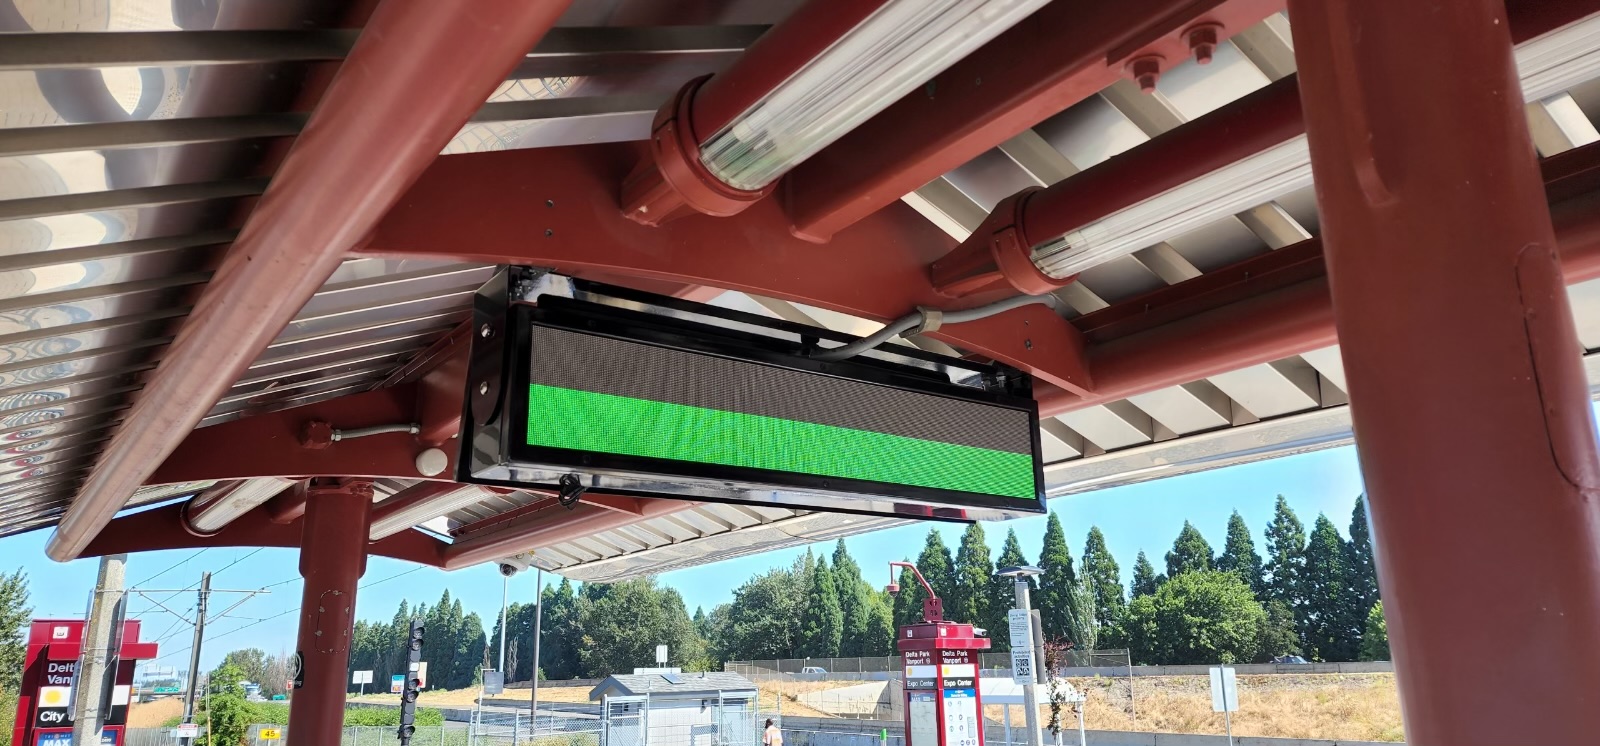
LED sign commissioning test, Delta Park/Vanport MAX station, 2022
TriMet: network display upgrade and the FX Division BRT line
Portland, OR · Field survey, vandal-resistance hardening and commissioning for a new bus rapid transit line · Part of the $175M FX2-Division BRT project
Challenge
TriMet was replacing arrival displays at transit centers and MAX platforms, some nearly two decades old, with new real-time signs. Widespread vandalism called for security shields on the signs, a supply-chain shortage forced a switch from LCD to LED for the large-format signs, and the new FX Division line needed its signs commissioned and working for opening day.
What I did
Traveled to Portland to survey the installed base and produced a report cataloging the bracketing and sign variations in the field, which informed the security shield designs. Wrote the field documentation for crews and agency staff, including component guides, installer app instructions, troubleshooting flowcharts and LED sign mock-ups for the Division line. Supported the LCD-to-LED substitution, and worked alongside TriMet's startup team through commissioning of the FX signs, handling configuration, testing and troubleshooting on the opening schedule.
Outcome
Hardened displays across the network and FX signs in service for the line's opening.
Technology and methodsLED signsSecurity shieldsField documentation
NCRTD: solar e-paper above 8,000 feet
Española, Taos and Taos Ski Valley, NM · Connectpoint · 5 solar-powered e-paper displays
Challenge
North Central Regional Transit District wanted real-time arrivals for riders in Española and Taos and up at the ski resort, a mountain site above 8,000 feet with deep snow, hard freezes and no practical mains power. Few places in the country are harder on a solar-powered sign.
What I did
At Connectpoint I delivered five solar e-paper displays across Española, Taos and the ski resort: preparing and checking the units and their solar power systems for high-altitude winter conditions, setting them up in the content management system, and supporting commissioning and ongoing operation.
Outcome
Among the highest-elevation e-paper transit displays in the US, the ski resort sign kept showing arrivals while buried under a foot of snow.
Technology and methodsConnectpointSolar e-paperHigh-altitude winter operationCommissioning
Show more case studies
City of Thousand Oaks: chosen after a six-vendor pilot
Thousand Oaks Transit tested real-time signs from six vendors over a 12-month pilot before choosing a platform for its fixed-route network, so reliability in the field mattered more than any brochure.
What I did
At Connectpoint I worked with the city from the pilot through rollout: solar evaluations of each stop, deployment planning with the city's project lead, installation support, content management system setup, and training city staff to manage the signs themselves.
Outcome
The Connectpoint signs needed no maintenance during the pilot and were selected, leading to 20 solar displays across five routes. The city cited their reliability and how easy it is to post special messages.
Technology and methodsConnectpointSolar e-paperSolar evaluationVendor pilotCMS training
DASH, Alexandria's bus system, wanted real-time arrival information at stops without trenching power to each one, and needed signs reliable enough to justify growing the program.
What I did
At Connectpoint I worked on the program from its five-sign start: solar evaluations of proposed stops, remote installation support, and training for DASH staff. I also worked on site in Alexandria on field diagnosis and power-system support, keeping the signs in reliable service.
Outcome
The program grew from 5 signs to more than 40, and the displays were also used to inform riders during rail station works. DASH noted that its test unit never failed.
Technology and methodsConnectpointSolar e-paperSolar evaluationField diagnosisStaff training
VTA: solar e-paper and interactive smart stops in San Jose
Santa Clara County, CA · CHK America and Connectpoint · Solar 10-inch e-paper bus stop displays and SmartStop pylons
Challenge
VTA was among the first US agencies to try e-paper real-time information at bus stops, with solar-powered 10-inch displays at individual stops and SmartStop pylons combining e-paper arrivals with an interactive tablet, all of which had to run reliably in the field without mains power.
What I did
I carried out solar evaluations for the stops, assembled and quality-checked the displays, and provided remote support and troubleshooting once they were in service. I also helped build two additional field-ready SmartStop units, each with two 13-inch e-paper screens, a Cradlepoint cellular router and an interactive tablet, for installation in San Jose.
Outcome
Solar-powered real-time arrivals at bus stops in San Jose, and an early example of an interactive, off-grid smart stop in service.
Technology and methodsConnectpointSolar e-paperInteractive smart stopAssembly and QASolar evaluation
LA Metro: Vermont corridor solar e-paper
Los Angeles, CA · 2024 to present · 45+ solar e-paper displays
Challenge
Vermont Avenue is one of the busiest bus corridors in Los Angeles, served by NextGen Line 204. The corridor's 45+ solar e-paper displays run on small urban solar systems, in a dense street environment where buildings shade many stops for part of the day. Keeping them reliably powered depends on getting the solar right at each site and knowing early when a site starts to struggle.
What I did
At Connectpoint I supported an earlier e-paper pilot for LA Metro. On the Papercast corridor, I directed south-facing panel orientation to make the most of the available sun. Configured and documented the OutdoorLink SmartLink relay thresholds that manage power to each display. Built fleet power monitoring for the corridor, with automatic alerts and a solar performance model that combines sun position, shade and panel orientation, and used it to identify weak chargers early.
Outcome
The corridor fleet is monitored continuously, and sites that begin to weaken are flagged and followed up before riders notice, with weak chargers identified and replaced before displays go dark.
Technology and methodsConnectpointPapercastSolar e-paperOutdoorLink SmartLinkFleet power monitoringSolar modeling
OCTA: from solar pilot to a fleet that runs through winter
Orange County, CA · Connectpoint pilot, then Papercast support from 2024 · Solar e-paper displays with solar stop lighting
Challenge
Orange County Transportation Authority uses solar-powered e-paper displays with integrated solar stop lighting. Small solar systems leave little margin, and power settings that look fine in summer can leave displays short of power in the shortest days of winter.
What I did
At Connectpoint I ran a solar e-paper pilot for OCTA. After the agency moved to Papercast displays, installed largely by solar partner Urban Solar, I took on technical support for the deployment, including reviewing and tuning the power-relay (OutdoorLink SmartLink) settings across the fleet for the shortest days of the year.
Outcome
Power settings tuned for winter across the fleet, and an engineer who knows both the earlier pilot hardware and the current system.
Technology and methodsConnectpointPapercastUrban SolarSolar e-paperOutdoorLink SmartLinkPower tuning
WMATA: Columbia Pike
Arlington, VA · 2018 · 110 solar e-paper displays, with later pilot support from 2024
Challenge
WMATA needed real-time passenger information along Columbia Pike in Arlington, on solar-powered displays that could also carry public messaging at short notice, which became essential during the COVID-19 period and the January 2021 unrest in Washington.
What I did
At Connectpoint I assembled and quality-checked the 10-inch solar-powered e-paper displays for the corridor, supported installation and commissioning remotely, set the devices up in the content management system, and provided ongoing support, including rapid-response public messaging: COVID-19 service updates, and urgent public safety and curfew messaging pushed out to the signs around the January 6, 2021 riot at the U.S. Capitol. Since 2024 I have supported WMATA's solar e-paper pilots, including content system and GTFS data configuration.
Outcome
110 displays in service along the corridor, keeping riders informed through a period of rapidly changing service.
Technology and methodsSolar e-paperContent managementPublic messagingCommissioning
Chicago Transit Authority: e-paper pilot
Chicago, IL · 2025 to 2026 · E-paper passenger information pilot
Challenge
CTA's solar and battery e-paper passenger information pilot needed displays ready for the street and a clear, coordinated plan for the field work that followed.
What I did
In October 2025 I worked on site with the display manufacturing partner on testing and field readiness before the displays shipped. In 2026 I created the field-crew work plans and coordinated the installer crew, and handled spare parts ordering and RMA tracking.
Outcome
Field-ready displays and a structured field program, with each site visit planned, recorded and followed up.
Technology and methodsPapercastE-paperField readinessField crew planningRMA tracking
Recognition
Programs I worked on received:
IoT Global Awards — Smart Cities winner (2023)
Global Digital Signage Awards — COVID-19 Response winner (2022)
Golden Bridge Awards — Gold, IT Hardware (2022)
Digital Signage Awards — Technical Innovation (2021)
In the news
Coverage of programs I worked on, from independent transit press to agency videos.
CTA’s solar and battery e-paper pilot, where I later worked on site with the manufacturing partner on field readiness and planned the field crew program.
Thousand Oaks Transit picks Connectpoint after a 12-month pilot against six vendors; I supported the pilot and rollout, from solar evaluations to staff training.
TriMet introduces its solar e-paper displays at bus stops and transit centers, the network upgrade I supported from field surveys to installer documentation.
Announces my start in CHK America’s information design and wayfinding team, the beginning of my transit career.
CHK America
Ways to work together
Fixed-scope packages with defined deliverables, each sized to your stops, fleet and schedule.
PlanPer stop or corridor
Site assessment
Know which stops can run on solar, and how to mount each sign, before hardware is ordered.
Deliverables
Field visit to each site
Shade and solar analysis from imagery, LiDAR and sun-path modeling
Pole, mounting and placement recommendation
Assessment report with a clear go / no-go for every site
DeployVendor-neutral
Pilot design
A pilot built to produce a confident buying decision, not just a demonstration.
Deliverables
Pilot plan: sites, platforms, duration and success criteria
Evaluation framework for power, connectivity, legibility and maintenance
Mid-pilot data review
Final evaluation and rollout recommendation
DeployPer program
Deployment program management
One accountable lead for getting signs installed, working and accepted.
Deliverables
Installation schedule and site sequencing
Installer coordination
Install records for every site
Acceptance checks and sign-off
Weekly progress reporting
OperateMonthly retainer
Monitoring and support
Weakening sites caught and followed up before riders notice.
Deliverables
Monthly fleet power and health monitoring
Alerts for failing or weakening units
Triage and remote troubleshooting
Monthly fleet report
About
I'm Kevin Bibby. I trained in geographic information science, remote sensing and cartography at UC Santa Barbara and started out in transit information design, producing static map products for systems including LYNX in Central Florida. I then spent a decade engineering and delivering passenger information systems for transit, from manufacturing and product engineering to leading multi-agency deployments.
That remote sensing background is unusual in this industry: I use aerial imagery, LiDAR and sun-path modeling to assess stops and predict solar performance before anything is installed.
I work directly with agency teams, from in-person working sessions with LA Metro staff and on-site visits with agencies including WMATA, to hands-on installation and commissioning in the field.
Contact
Planning a signage pilot, fixing a fleet that underperforms, or need an independent technical view?
Independent consultant based in Santa Barbara, California, working with agencies and suppliers nationwide, on site or remotely.